
 The Issue
When Scheduler is running, clouds can come in and disrupt operations. Obviously the threat of rain applies, but it also seems worthless to try and image when the sky is cloudy.
I do have a Davis Vantage Pro/2 Weather station, so I can detect windy and rain conditions.
I previously bought an ACP weather server, but that guy is now retired / out of business. I couldn’t ever get it configured appropriately – there are a million options. It really expects a Boltwood Cloud Sensor or equivalent.
Cloud Sensor Techniques
I see three basic techniques being used for cloud detection.
Sky Temperature Infrared Measurement
The Boltwood Cloud sensor is the classic definition of this sensor, although there are several competing units on the market.These units can be fairly expensive.
Usually an aluminum plate is aimed at the sky, where it is warmed by the infrared radiation from the sky.The sky temperature is compared to the ground ambient temperature. A clear sky is very cold (perhaps -40C). Clouds will reflect IR back to the ground, appearing warmer.
I owned one of these units on my previous observatory. The fundamental problem I had was that the threshold criteria for cloud detection changed from season to season, even day to day.
Another similar technique is to use a small IR detector chip, perhaps paired with something like an Arduino or Raspberry Pi to make the temperature measurement. I have seen several posts where people are investigating this approach, but I haven’t seen a completed project with details on how this approach was implemented.
Reversed Peltier Cooler
This technique runs a Peltier cooler in reverse. Normally a voltage applied to a Peltier chip causes the chip to get colder; the removed heat is dissipated with a heat sink. In the reverse mode the presence of the cold (cloudless) sky causes the cooler to generate a small voltage
All Sky Camera
In this approach a camera images the entire sky. The visible stars are counted by software; the more stars detected, the clearer the sky.
All Sky cameras are fairly common now, although the equipment is a bit expensive. However, these are generally intended for manually checking the sky. I do not see many systems with the software to count the stars and yield a cloudy/clear measurement. The only ones I found were academic investigations; implementation details were not provided, and they use in-house software developed for their research project.
Here is a link to a DIY AllSky camera. It does not sound like he has implemented star counting, etc.
https://www.instructables.com/id/Wireless-All-Sky-Camera/
His github location is https://github.com/thomasjacquin/allsky.
A discussion of cloud detection is at https://www.researchgate.net/publication/317022372_Cloud_Detection_and_Prediction_with_All_Sky_Cameras although this does not have details on hardware and software available to implement this system.
My Inexpensive Solution
My solution for cloud detection is a “poor man’s” approach, where no hardware is involved.
My typical approach when manually running ACP for a night is to check 3 web sites for weather forecast for the night:
- Meteoblue.com. Their main page has good information, including satellite videos of clouds for the area. On the left side menu select Outdoor & Sports / Astronomical Seeing. They give an excellent image showing clouds and moon for the night. I have found them to be very useful.
- Weather Channel forecast (weather.com). Check my location to see if it will be clear for the night. I have found this information to be accurate in my current location, although it tended to be less accurate in upstate New York.
- Clear Sky Clock. While I do look at this, I have not found it to be as accurate as the other two systems.
While these sites work fine for manually running ACP runs, the Scheduler environment really needs an automatic ACP Weather Server. My BrewWeather.Weather server uses two input sources for the server.
- The Accuweather web site api is used to retrieve the current forecast for my location. In addition to getting a cloudiness value it gives wind speed and temperature. This is my primary concern for the weather issue. This data is retrieved from the Accuweather server as described below.
- My Davis weather system provides a number of data values (wind, rain, temperature, humidity, and so on). This data is transmitted from the WeatherDisplay program via a simple text file placed in DropBox. The file is a Clarity format file.
The weather Safety rating is based on 3 data points:
- Clouds. Based on the Accuweather forecast.
- Rain. Based on the Davis data.
- Wind gusts. This is based on the Davis data, cross checked with the Accuweather forecast.
A variety of informational values are displayed, but not used for determining observatory safety.
Accuweather API
The site http://dataservice.accuweather.com describes the API used to retrieve the forecast data.
You first need to establish an account. The free account works fine for me; you are limited to the number of requests you can make per day. Your account includes a webAPIkey used in the various calls.
The data retrieval centers on two calls.
Location Code
This call determines your location code; I use my zip code. This code is used in the subsequent call to retrieve the focus.
The call looks something like the following, where my account webAPIkey and zip code are filled in.
http://dataservice.accuweather.com/locations/v1/postalcodes/search?apikey=MyAccountApiKey&q=MyZipCode HTTP/1.1
The location code does not change very often at all. It sounds like it might rarely change when they modify their database somehow, restructuring the keys. To stay within my daily allotment of calls I cache the resulting LocationCode; it is actually updated once a day.
Current Conditions
The current weather conditions are retrieved using a similar call.
http://dataservice.accuweather.com/currentconditions/v1/LocationCode?apikey=MyAccountApiKey
I cache this data as well, because their data is only updated every 15 minutes or so. Apparently this is not a fixed interval – if things are changing they may update more frequently. I generally update the current conditions every 15 minutes.
User Interface
The server BrewWeather.Weather is enabled in ACP.
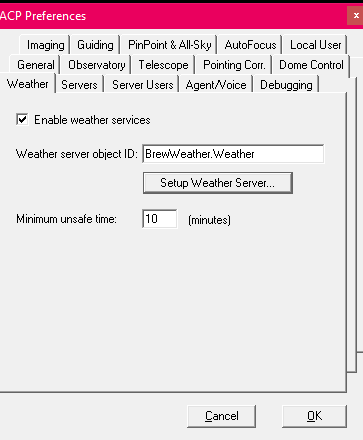
The Setup Dialog is used to select the Davis weather file and set the Accuweather api key values.The Setup Dialog may be accessed through the Setup Weather Server button seen above, or using the popup menu from the LED Light by right clicking on the light.
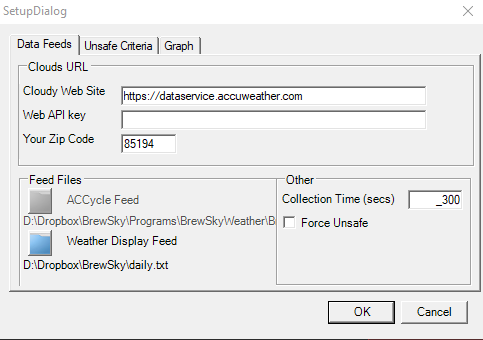
Setup Dialog Fields
The Clouds URL fields define the Accuweather web site, your Accuweather account API Key, and your zip code.
The Feed Files show 2 feeds. The ACCycle Feed is not used. The Weather Display feed shows the file location of the Clarity-format file of data from the Davis weather system. The blue button brings up a dialog box for locating the file.
The Collection time defines how often the server checks weather data for updates. Note that the data does not necessarily change that fast; the WeatherDisplay generation of the feed occurs on a user defined schedule (I update every 5 minutes). The Accuweather data is generally updated every 15 minutes.
Force Unsafe is used for testing purposes. It allows the system to be unsafe even if the current conditions do not fail safety criteria.
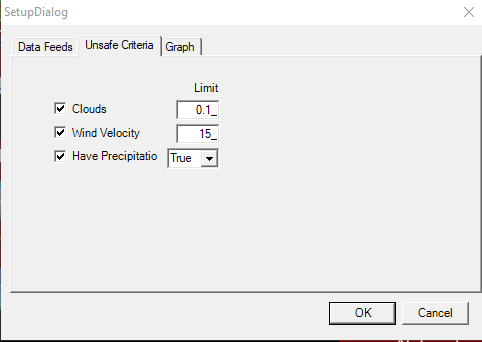
The Unsafe Criteria tab is used to define safe criteria for these fields. In this example the Clouds field has a limit of 0.1 (out of 0-1). A value above 0.1 will cause the server to go into the Unsafe state. A wind velocity over 15 mph also causes Unsafe. Lastly, the detection of precipitation from the Davis detector will cause Unsafe.
The graphing feature is an idea at this time but has not been implemented.
Running Interface
 When the weather server is connected the “LED Light” is shown. It starts as gray (off), then turns either green (Safe) or red (Unsafe) when the data sources are read.
The LED Light may be dragged to another position on the screen.
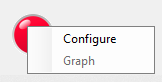 Right click on the LED Light to get a menu. At the moment the only option is to Configure (bring up the Setup Dialog).
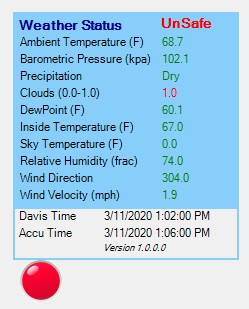
Hovering over the LED Light pops up a small window (similar to a ToolTip) showing the current weather values. Values are color coded to indicate whether they are Safe (green) or Unsafe (red). The latest time stamp of each feed is shown at the bottom of the window.
In this example the Clouds value of 1.0 (Cloudy) trips as Unsafe because the Setup Dialog / Unsafe Criteria tab defines the Cloudy limit as 0.1. This causes the overall status to be Unsafe.
Implementation Details
The server is written in Visual Studio VB.Net, creating a dll. The dll is registered by Visual Studio; one would have to figure out to run regsvr32 to register it on a different machine.
Observatory computer runs Scheduler/ACP. Separate desktop collects the Davis weather data which also feeds my personal web site.